
Observability
This feature integates MicroStack with (and optionally deploys) the Canonical Observability Stack (COS). MicroStack will automatically propagate default metrics and dashboards, enabling you to effortlessly monitor the status of your single-node or multi-node deployment of Sunbeam without the need for any additional setup.
This feature provides ability to connect to an existing external COS or deploy COS within the cloud.
Connect to an existing COS
Enabling Observability
Register the external controller hosting COS in MicroStack.
Ensure the Juju user has consume permissions granted on the observability related offers.
To enable MicroStack observability integration, run the following command:
sunbeam enable observability external CONTROLLER GRAFANA_DASHBOARD_OFFER_URL PROMETHEUS_RECEIVE_REMOTE_WRITE_OFFER_URL LOKI_LOGGING_OFFER_URL
CONTROLLER is the name of external Juju controller that hosts COS.
GRAFANA_DASHBOARD_OFFER_URL is the remote Offer URL for Grafana Dashboard.
PROMETHEUS_RECEIVE_REMOTE_WRITE_OFFER_URL is the remote Offer URL for Prometheus.
LOKI_LOGGING_OFFER_URL is the remote Offer URL for Loki.
Disabling Observability
To disable Observability, run the following command:
sunbeam disable observability external
Deploy COS in MicroStack
Enabling Observability
To enable Observability, run the following command:
sunbeam enable observability internal
Disabling Observability
To disable Observability, run the following command:
sunbeam disable observability internal
Retrieve Grafana dashboard URL
To get the URL of the dashboard use the dashboard-url command:
sunbeam observability dashboard-url
Sample output:
http://10.20.21.13/observability-grafana
This URL points to the Grafana login page. The credentials to use can be retrieved using this command:
juju run --model observability grafana/leader get-admin-password
Sample output:
Running operation 1 with 1 task
  - task 2 on unit-grafana-0

Waiting for task 2...
admin-password: ******
url: http://10.20.21.13/observability-grafana
Only the initial admin password is displayed in the above action. If the admin password is changed using the Grafana UI, a message Admin password has been changed by an administrator will be displayed.
Login Grafana dashboard
Once the COS model is deployed, you can use the Grafana dashboard to view the metrics and alerts configured.
The login page asks for the following information:
Email or username: admin
Password: ******
The login page looks like this:

After a successful login, you should see the landing page:
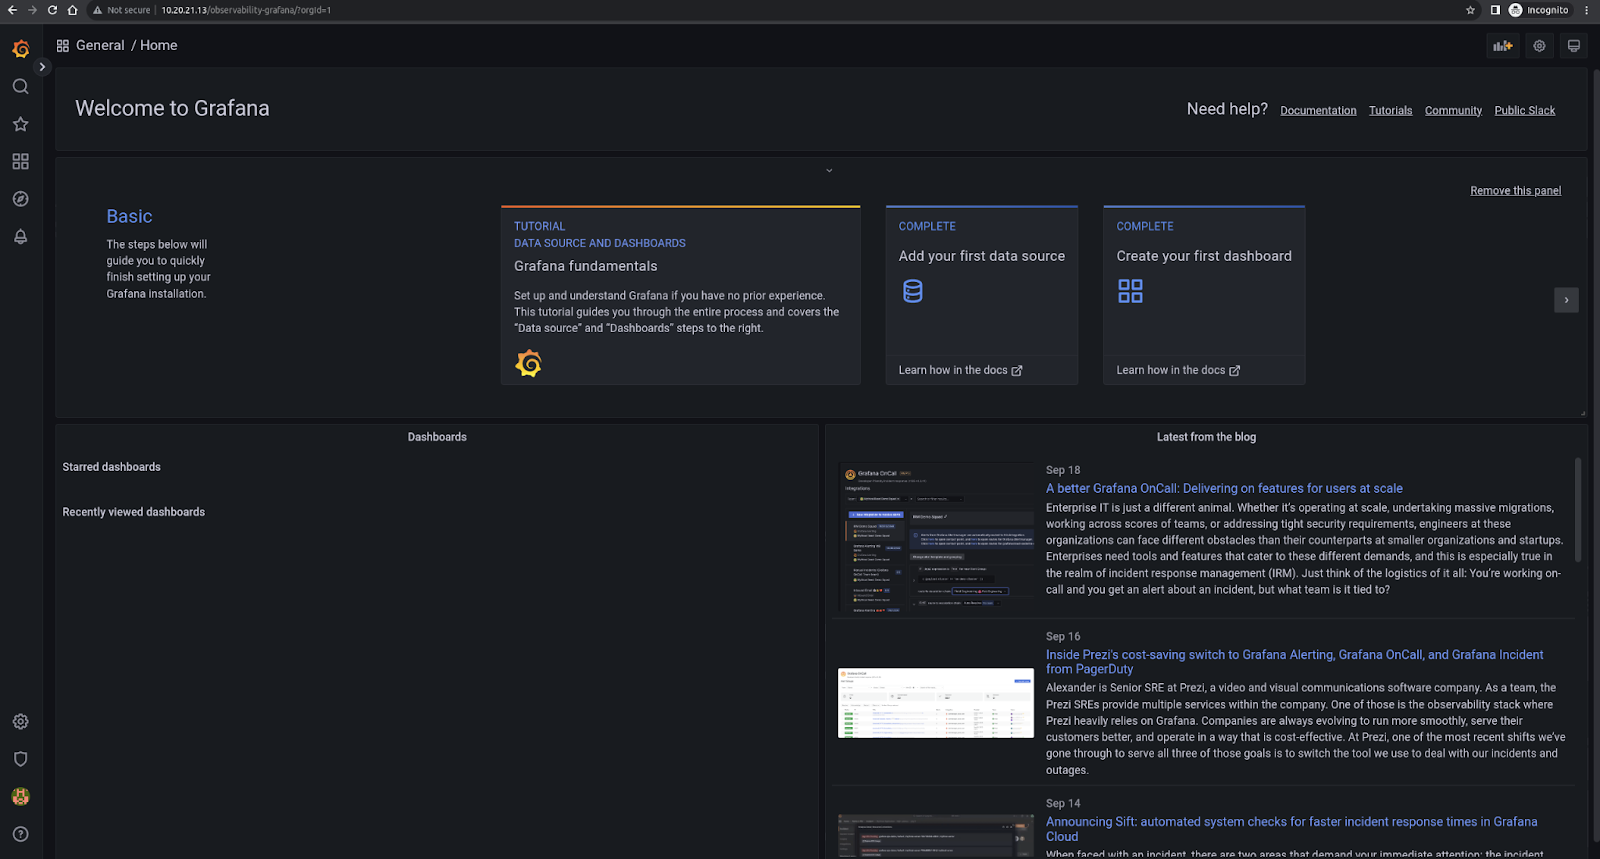
You can now look at the different dashboards configured.
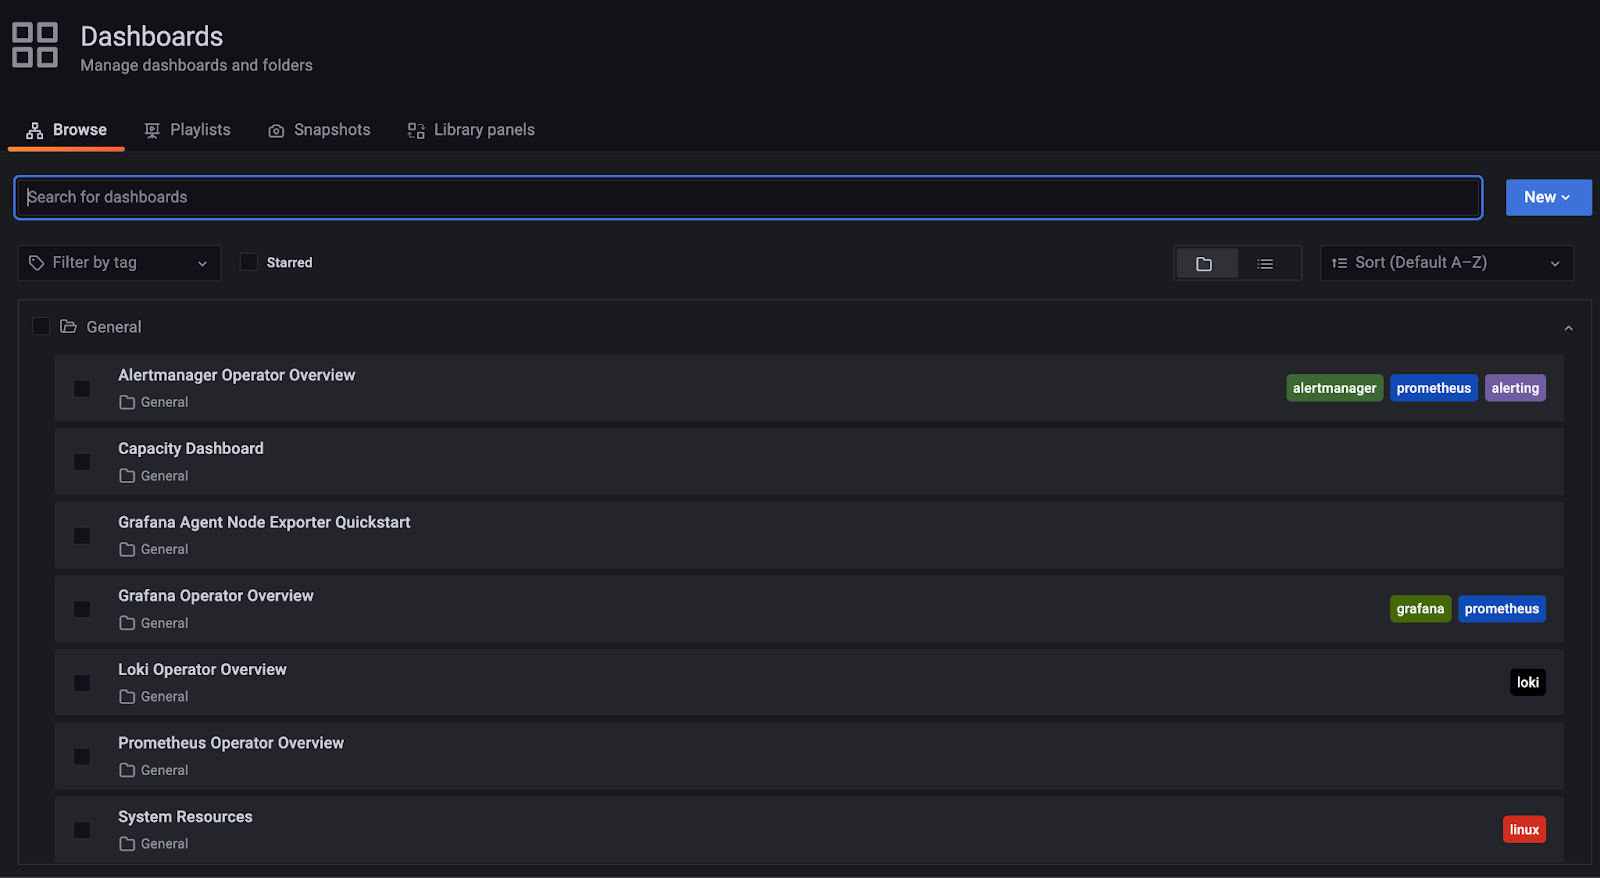
Dashboard
Note: Dashboard is currently only supported in channel 2023.2 of the openstack snap.
OpenStack Service Overview dashboard
This is a dashboard providing an overview of the OpenStack services and stats.

OpenStack Cloud Usage dashboard
This is a dashboard providing information on the usage of the OpenStack cloud (for example, projects and and vms), using metrics mostly from openstack-exporter.

OpenStack Compute Overview dashboard
This is a dashboard more detailed information on the compute nodes, using metrics mostly from the libvirt exporter.

Capacity Dashboard
Capacity Dashboard displays the overall capacity (storage, memory, and cpu) of the microstack cluster, as well as the capacity of individual microstack node.

Days until storage / memory / CPU reaches threshold
“Days until storage / memory / CPU reaches 90%” shows the estimated days until these resources reach 90% of their total capacity. This is a linear projection based on the average usage over the past 360 days. If the average usage is zero or negative, the panel will show “Stable” because it’s not possible to estimate when they will be depleted. For the overall capacity, this estimation is chosen to be the minimum value across all microstack nodes. For example, if the projected days it will take for storage consumption to reach 90% is about 80 days for node 1, 90 for node 2, and “Stable” (i.e. not expected to run out given the current trend) for node 3, then the panel will show “80” since node 1 will be the first one to exhaust its storage.
The node-specific panels estimate resource consumption only within the given node.

You can filter the nodes using the multi-select dropdown menu: Hostname.
The 90% threshold and the 360 days of estimation can also be changed using the dropdown menu: Resource Usage Threshold and Days of Estimation.
Disk usage
“Disk usage (total size: …GB)” shows the usage of filesystems mounted on the nodes. For the overall capacity, “Disk usage” shows the total usage of all mounted filesystems for each node. The individual disk usage capacity panel shows disk usage of each mounted filesystem on a particular node.
Memory usage
“Memory usage (total memory: …GB)” shows the total memory usage, memory assigned to hugepages, and used hugepages memory. For the overall capacity, “Memory usage” is summed over all microstack nodes. The individual memory capacity panel shows the memory usage of a particular node.
CPU usage
“CPU usage (total number of cores: …)” shows the CPU usage on the nodes. For overall capacity, “CPU usage” shows the CPU usage of each node as separate series. The individual CPU capacity panel shows the CPU usage of a particular node.
OpenStack Project Overview dashboard
This is a dashboard that provides detailed information about a single project, including limits and a table of virtual machines. It uses metrics from openstack-exporter.
